Android 17 Stopped Waiting for Memory Pressure
The memory subsystem is where Android 17 did its most consequential work, and it did it almost entirely out of view. No single piece of it is a headline, and the whole of it is the most interesting change in the release.
Android 17 rebuilt how the platform manages memory. Not with one new daemon or one new setting, but with five separate mechanisms, sitting at four different layers of the stack, all pushing in the same direction at once. On their own each one is a footnote. Together they are a clear statement of intent: Android is done waiting for memory pressure to show up and then reacting to it.
Let me walk through what changed, bottom to top, and then what it means if you are the person staring at a bugreport trying to work out why a device janked.
The old way#
For most of Android’s life the memory model has been reactive. lmkd, the low memory killer daemon, watches PSI, the kernel’s pressure stall information. When pressure crosses a threshold, lmkd starts killing processes in oom_score_adj order, worst offender first. It works, and it has worked for years, but the shape of it is the point. Nothing happens until the system is already under stress, and when something does happen, the response is to kill. Each process is more or less on its own until the reaper shows up.
That is the model Android 17 moves away from. The four layers, and how each one changed:
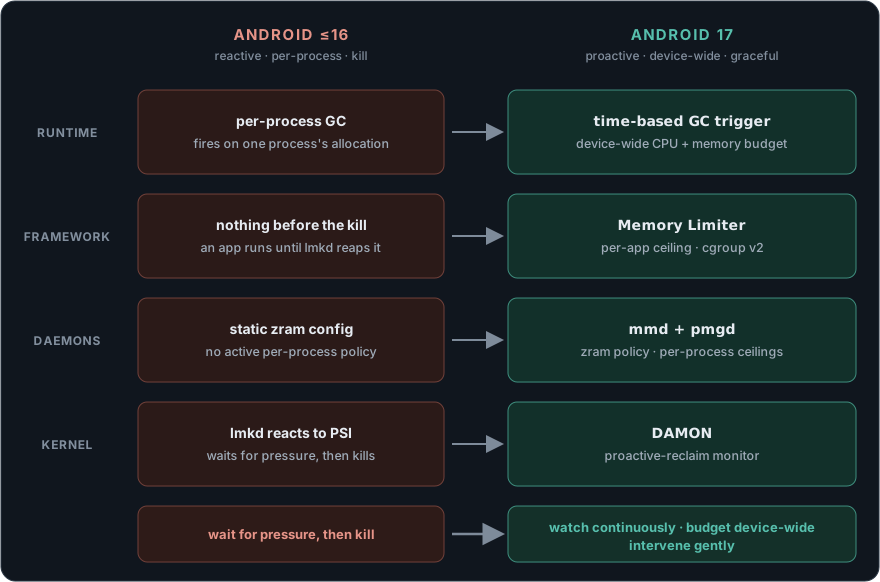
Now the same thing, layer by layer.
The kernel: DAMON#
At the bottom, the GKI kernel for 17 ships with DAMON enabled in the defconfig (CONFIG_DAMON=y). DAMON is upstream Linux’s data access monitor: it watches how often regions of memory are actually accessed, which is the groundwork for proactive reclaim, reclaiming cold pages before anything is forced to.
One caveat worth stating. Android 17 rebases GKI onto kernel 6.18, and DAMON being on could be a 6.18 upstream default rather than an Android decision. I would not call it a deliberate Android choice without more digging. But the 17 kernel does ship the proactive-reclaim monitor, and that is the foundation everything above it can lean on.
The daemons: mmd and pmgd#
One layer up are two userspace daemons, both living in platform/system/memory next to lmkd.
mmd, the memory management daemon, is a Rust service that handles zram maintenance, the recompression and writeback of compressed pages. It is not new in 17 (it shipped around the Android 15 QPR2 timeframe), but it belongs in this picture: zram housekeeping now runs under daemon policy across the device rather than from static config.
pmgd, the process memory guardian daemon, is the newer one. It has its own release flag, and it shows up wired into init as a core service, trigger-started, running as nobody, reading from /proc:
# system/memory/guardian/pmgd.rc
service pmgd /system/bin/pmgd
    class core
    user nobody
    group system readproc misc
    disabled
Its job is to enforce per-process memory ceilings, and to do it gracefully: lean on a single leaking or spiking process before the whole system feels it. If you are pulling a bugreport apart, it surfaces as the pmgd service.
The framework: the Memory Limiter#
Higher still, the framework gained per-app memory limits, sized off the device’s total RAM, conservative at first, and aimed at extreme leaks and outliers rather than at normal apps. Underneath they are built on cgroup v2. This is the user-visible face of the same idea pmgd serves lower down: stop one app from dragging down the whole device.
The detail worth knowing is what it leaves behind. When the Memory Limiter kills an app, the exit reason is REASON_OTHER and the description in ApplicationExitInfo.getDescription() contains the string MemoryLimiter:AnonSwap, and you can capture a heap dump off the anomaly trigger. So it is greppable, which is more than you can say for a lot of memory events. (This is also the one piece Google blogged directly, worth noting, because they documented the app-facing piece and not the system-wide pattern it belongs to.)
The runtime: a time-based GC trigger#
At the top, in ART, the runtime did not change its collector. CMC, the concurrent mark-compact collector, has been the default since 16, so your GC-pause signatures do not move and there is nothing new to re-learn there.
What is new is a time-based GC trigger. In ART’s own words, “the more time has passed since the previous GC in an app, the lower the threshold is for triggering the next GC”, collection follows a device-wide CPU and memory budget instead of firing purely on a single process’s allocation. That changes when collections happen, and you will see the difference in traces. It is a small change in size and a telling one in direction, because it is the same move as everything below it: take a decision that used to be made per-process under local pressure, and make it against a device-wide budget instead.
What ties them together#
| Layer | Mechanism | New in 17? | Bugreport fingerprint |
|---|---|---|---|
| Kernel | DAMON proactive reclaim | In the 17 GKI, possibly a 6.18 upstream default | n/a |
| Daemons | mmd (zram recompress/writeback) | No, ~A15 QPR2 | mmd |
| Daemons | pmgd (per-process ceilings) | Yes, own flag + init.rc | pmgd service |
| Framework | Memory Limiter (cgroup v2) | Yes | MemoryLimiter:AnonSwap exit reason |
| Runtime | time-based GC trigger | Yes | shifted GC timing in traces |
Four layers, five mechanisms, one release. The old model was reactive, per-process, and pressure-triggered. The new one is proactive (DAMON watching before pressure exists, GC firing on a budget), device-wide (the Memory Limiter protecting the system from any one app, GC budgeted across the whole device), and graceful (pmgd leaning on a process before lmkd has to kill anything).
It is easy to over-read a pattern, so a caveat. I cannot prove all of this was one coordinated program, and the DAMON config might just be what 6.18 ships. But the direction is not ambiguous.
Whether by plan or by convergence, Android 17’s memory subsystem is being pulled away from “wait for pressure, then kill” and toward “watch continuously, budget device-wide, intervene gently.”
What it means if you debug Android#
Every one of these mechanisms inserts a soft-landing tier in front of the old terminal path:
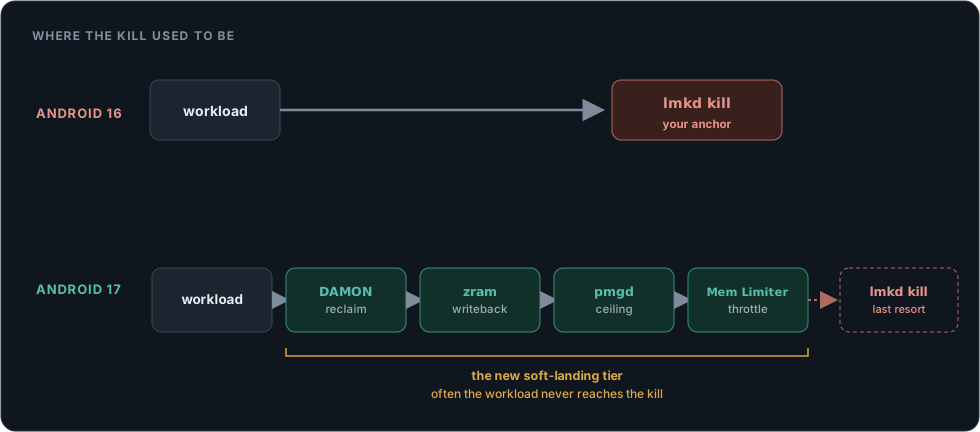
For years your strongest memory signal in a bugreport was terminal: an lmkd kill ordered by oom_score_adj, an OOM kill in dmesg, a tombstone. Those were the anchors you triaged on. Android 17 puts a layer of throttling, ceiling enforcement, and proactive reclaim ahead of all of them. So here is the trap:
| Android 16 | Android 17 | |
|---|---|---|
| Strongest signal | lmkd kill, OOM in dmesg, tombstone | a soft-landing tier in front of the kill |
| Same workload | a clean kill you can anchor on | often no kill: memory.high reclaim, per-cgroup PSI, zram writeback, jank |
| The reading | “kill means memory was the problem” | “no kill” reads as clean while the device was actually thrashing |
The absence of a kill is no longer evidence that memory was fine. In 17, “no kill” and “healthy” are no longer the same thing.
The signals shift accordingly. What to key on now:
# the kill that still happens
ApplicationExitInfo.getDescription()  contains  "MemoryLimiter:AnonSwap"   (REASON_OTHER)

# the throttle that replaced the kill  (per-cgroup)
memory.events:  high counter climbing   while   oom_kill   stays flat
PSI:            full-stall on individual app cgroups
zram:           writeback rate trending up across the session

# the new captures (ProfilingManager)
TRIGGER_TYPE_OOM / TRIGGER_TYPE_ANOMALY / excessive-CPU-kill  ->  heap dumps + traces,
delivered at the moment you used to have to reconstruct after the fact
The short version: in 17, the interesting part of the memory story moved into the throttle tier, and your triage has to move with it.
Where this goes#
I think this is the start of a longer move rather than the end of one. Per-process budgeting and proactive reclaim are clearly the direction, and 17 is the release where the pieces showed up together, across the kernel, two daemons, the framework, and the runtime, in one go.
If you maintain triage tooling, or you are the one staring at these bugreports every day, I would like to know whether you are already seeing the throttle-without-kill pattern, and how you are adjusting. My read is that the teams who keep anchoring only on kills are going to start missing things in 17, and I would be curious whether that matches what you are seeing on real devices.

Android 17 Moved Cellular-Attack Detection Into the Platform
Detecting fake cell towers used to require a rooted phone and SnoopSnitch. In Android 17 it is a …
Android 17 Built a Sealed Room for On-Device AI
AISeal is a confidential-computing sandbox for on-device personal-data AI, a protected VM with 16 GB …
The Dark Art of Postmortem Debugging
Getting a dump and reading a dump are two separate locked doors, and almost no one holds both keys. …